In the world of machine learning for audio, DSP or any aspect of the audio engineering industry which involves looking at audio data and working with it, the term spectrum analysis will appear.
When you first start looking into audio spectrum analysis, understanding what it is and how it is helpful in the real world can be daunting, as audio signal processing is complex. As a result, explanations can quickly get very confusing and overwhelming.
In straightforward terms, audio spectrum analysis (also known as audio spectral analysis) is a processing technique used to analyse the frequency properties of an audio signal.
Many audio engineering experts with far more experience than me will give you a more comprehensive explanation. However, when you are starting in the field of audio data processing, we complete audio spectrum analysis to learn more from an audio signal.
I will break down audio spectrum analysis into its most basic explanation in this article. It is essential to understand that this is a complex subject, and this article is intended as a straightforward overview for those who work in the industry and need to have some basic understanding of what audio spectrum analysis is and what we use it for.
I will cover:
- What is spectral analysis?
- Is spectrum and spectral analysis the same thing?
- How does spectral analysis work?
- What are real-world audio applications of spectral analysis?
- What is a spectral plot?
- What is a spectrogram?
- How do I read a spectrogram?
What Is Spectral Analysis?
Spectral analysis, or frequency domain analysis, is a mathematical technique to interpret complex signals. It breaks down a signal into its constituent frequencies, displaying them as a spectrum of amplitudes at corresponding frequencies.
The most elegant definition of spectral analysis that I can find is from the book titled Spectral Analysis of Signals authored by K. Deergha Rao & M.N.S. Swamy::
“The process of determining the frequency contents of a continuous-time signal in the discrete-time domain is known as spectral analysis.” [source]
Let’s break down this definition further, explaining how we apply this in the real world.
A continuous-time signal is any signal with continuous amplitude and time. In the world of audio, an example of a continuous-time signal is an analogue signal. Such an audio signal (like music) has lots of data as we have multiple frequencies with different amplitudes and times.
Audio signals have three key components,
- Time period – how long the signal lasts for
- Amplitude – how loud we perceive the sound
- Frequency – how my vibrations per second.
In the world of audio, we are generally concerned with the frequencies in a signal.
To determine the frequency contents of a continuous signal, we can use the Fourier Transform to decompose a signal into its constituent frequencies. [source]
In a nutshell, audio spectrum analysis is this process which lets us analyse the frequency properties of an analogue audio signal.
Through the spectral analysis process, we can break down an audio signal into its frequency components to learn more about the audio signal, characterising its structure and frequency components.
In audio applications, spectral analysis can help identify individual notes within a complex sound, detect noise in audio signals, or even facilitate the restoration of old recordings. This process is fundamental for sound engineers, music producers, and anyone working with audio signals, as it provides deeper insight into the characteristics and quality of the sound.
Is Spectrum And Spectral Analysis The Same Thing?
While the terms ‘spectrum’ and ‘spectral analysis’ are related, they differ. The spectrum refers to the range of frequencies a signal contains, often visualised as a graph with amplitude (or power) on the vertical axis and frequency on the horizontal.
On the other hand, spectral analysis is the process through which we obtain this spectrum. It involves mathematical techniques that decompose a complex signal into its constituent frequencies, enabling us to see the spectrum.
So, while the spectrum is the end product, spectral analysis is the means to get there.
That said, like most things in engineering, words always get used interchangeably. Therefore, if you interchangeably use the term spectrum and spectral in the office, your colleagues should still know what you are talking about.
I find that the difference between spectrum and spectral analysis becomes essential when writing academic papers, as the author should use the correct term in the context of the work.
How Does Spectral Analysis Work?
Spectral analysis operates on the fundamental principle of Fourier’s theorem, which asserts that any function of time, including an audio signal, can be constructed using a sum of sine waves of different frequencies, amplitudes, and phase shifts. This is key to the process of spectral analysis.
The first step in spectral analysis is to digitise the audio signal if it is not already in a digital format. This process is called sampling and is achieved by measuring the audio signal’s amplitude at regular intervals.
Next, the Fast Fourier Transform (FFT) is applied, a complex mathematical algorithm that transforms the time-domain signal into a frequency-domain representation. It separates the digitised signal into its constituent frequencies, revealing the different sine waves that make up the signal.
The output is a spectrum displaying all the frequencies present in the audio signal and their respective amplitudes. In this way, spectral analysis provides a detailed view of the sound’s signal, allowing for more nuanced alterations, analysis, and understanding.
The above description is overly simplified as the actual methods and details can quickly become very complex. For more detailed information, I recommend checking out this article.
What Are Real World Audio Applications Of Spectral Analysis?
Spectral analysis is widely used in numerous real-world audio applications. For instance, music production allows sound engineers to pinpoint individual notes within a complex piece of music or identify unwanted frequencies for elimination.
In telecommunications, we employ spectral analysis to detect noise in audio signals and improve sound quality.
Furthermore, acoustics facilitates the design of spaces for optimal sound performance by analysing how different frequencies behave within the room.
Spectral analysis also holds a crucial role in restoring and digitising old, deteriorated audio recordings: detecting and reducing noise, crackles, and other audio defects.
This spectrum-based technique is also used in healthcare, particularly in analysing heart sounds and lung noises, aiding in detecting and diagnosing various medical conditions.
Thus, spectral analysis, with its capacity to decompose audio signals into constituent frequencies, is instrumental in diverse fields, enhancing our interaction with and understanding of sound.
What Is A Spectral Plot?
A spectral plot, also known as a frequency spectrum plot, is a visual representation of a spectrum obtained from spectral analysis. It is a graph that displays the different frequencies in an audio signal plotted against their corresponding amplitudes or power levels.
The horizontal axis represents the frequencies, typically ranging from low (left) to high (right). In contrast, the vertical axis represents the amplitude or power of each frequency, usually measured in decibels (dB).
Spectral plots are essential in various fields, including audio engineering, music production, and telecommunications. They allow professionals to visually identify dominant frequencies, detect noise or other unwanted frequencies, and analyse the overall frequency composition of a signal.
Thus, a spectral plot is a powerful tool for understanding and manipulating audio signals.
What Is A Spectrogram?
A spectrogram is a visual depiction of the spectrum of frequencies in an audio signal as they vary with time. It displays how the frequencies of a signal are distributed with respect to time.
On a spectrogram, the x-axis represents time, the y-axis represents frequency, and the colour or intensity represents the amplitude or power of each frequency at any given moment in time.
This allows for a detailed examination of the frequency content of an audio signal as it evolves.
Spectrograms are commonly used in fields like music production, linguistics, and bioacoustics. They provide invaluable insights into features such as harmonic structure, noise components, and other elements of a sound that may change over time. Thus, a spectrogram is a powerful tool for comprehensively analysing audio signals.
How Do I Read A Spectrogram?
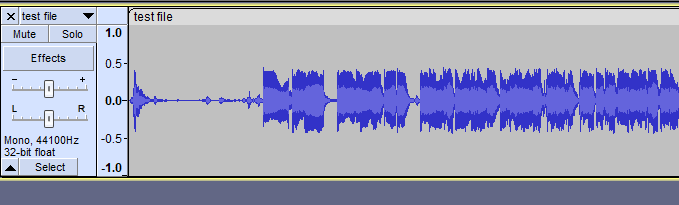
You can view any audio file as a spectrogram using free software tools such as Audacity.
For example, below is a snapshot of a .WAV file and its corresponding spectrogram
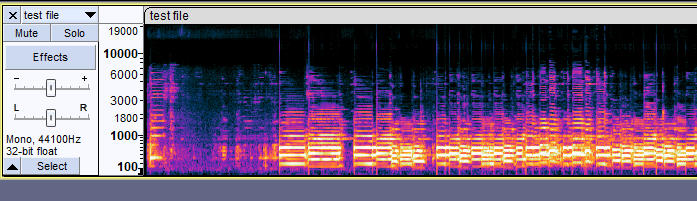
Reading a spectrogram involves interpreting the various elements represented on the graph.
On the x-axis, time is represented, moving from left to right. This means that as you move from left to right on the spectrogram, you are moving forward in time through the audio signal.
On the y-axis, frequency is denoted, with lower frequencies at the bottom and higher frequencies at the top. Hence, the position of a mark vertically on the spectrogram represents its frequency.
The spectrogram’s colour or intensity represents the frequencies’ amplitude or power. Typically, darker colours or more intense areas indicate higher amplitudes or power, meaning these frequencies are more prominent in the sound at that particular time.
Lighter colours or less intense areas represent lower amplitudes, indicating these frequencies are less dominant.
By understanding these elements, you can identify patterns and features within the spectrogram.
For instance, vertical lines or stripes indicate short, sudden sounds at specific frequencies, whereas horizontal lines represent steady, continuous sounds.
Shapes or clusters of intense colours can indicate specific features of the audio signal, like the harmonics of a musical note or the formants of a vocal sound.
Thus, reading a spectrogram involves understanding the axis and colour intensity and interpreting the shapes and patterns that appear within the plot.
Final Thoughts
In conclusion, spectral analysis is an extraordinarily powerful tool in our daily interaction with and understanding of sound. It provides detailed insights into the composition of audio signals and enables us to manipulate and improve them in various fields, from music production to healthcare.
The visual representations provided by spectral plots and spectrograms further enhance our ability to analyse and interpret these signals over time. While interpreting these visualisations may initially seem complex, with practice and understanding of the basic components behind them, they can be easily understood and applied to both audio engineering and acoustical design.