A speaker impedance curve is something that you will encounter frequently when working as a speaker designer.
At first, it’s hard to read a speaker impedance curve, but by knowing some basic principles, you can improve your speaker knowledge and understand these graphs.
A speaker impedance curve tells us fundamental properties of a speaker, including the speaker resonance frequency and DC resistance (Re). In addition, the shape of the curve can tell us how well damped a speaker is.
For a graph that is so universally recognised, it can still be hard to comprehend the fundamentals of a speaker impedance curve and how to read it as a speaker designer.
In this article I will cover:
- What is speaker impedance?
- What is a speaker impedance curve?
- How do you read an impedance curve?
- How is a speaker impedance curve measured?
What Is Speaker Impedance?
Before looking at the speaker impedance curve, it is important to understand what speaker impedance actually is.
Speaker impedance is the measure of opposition to the flow of electric current in an electrical circuit, measured in ohms. It can be thought of as a measure of the resistance of a speaker to the flow of electricity.
This resistance is caused by the air in the speaker, and its voice coil winding resistance (measured in ohms).
When designing a speaker, it is important to understand the impedance of the speaker, as this will determine how much current is flowing through the speaker, and how much power is dissipated as heat.
Impedance Vs Resistance
The terms impedance and resistance often get used interchangeably, however, there is a clear distinction.
We use the term resistance when talking about the resistance of a system to DC current.
We use the term impedance when talking about the resistance of a system to AC current. AC stands for alternating current, and as the current is alternating, not only will we have magnitude, but phase as well.
(To keep things simple, I will not discuss the phase aspect of an impedance curve in this article and will cover this in greater depth in a phase-specific article soon. )
In speaker systems, we use AC current, therefore we use the term impedance when discussing speakers.
As a side note, you may have noticed the term Re or resistance on speaker specification sheets.
When we use the term Re on speaker systems, we are referring to the resistance of the voice coil to current.
What Is A Speaker Impedance Curve?
A speaker impedance curve is a graph that typically represents the electrical resistance of a speaker at different frequencies.
The x-axis on the graph represents frequency (measured in Hz), while the y-axis represents impedance (measured in ohms).
As mentioned, since impedance relates to the resistance to alternating current (AC), the impedance will also change with frequency.
As a result, to view impedance, it is best to plot it on a curve so we can see how impedance will change with frequency.
How Do You Read An Impedance Curve?
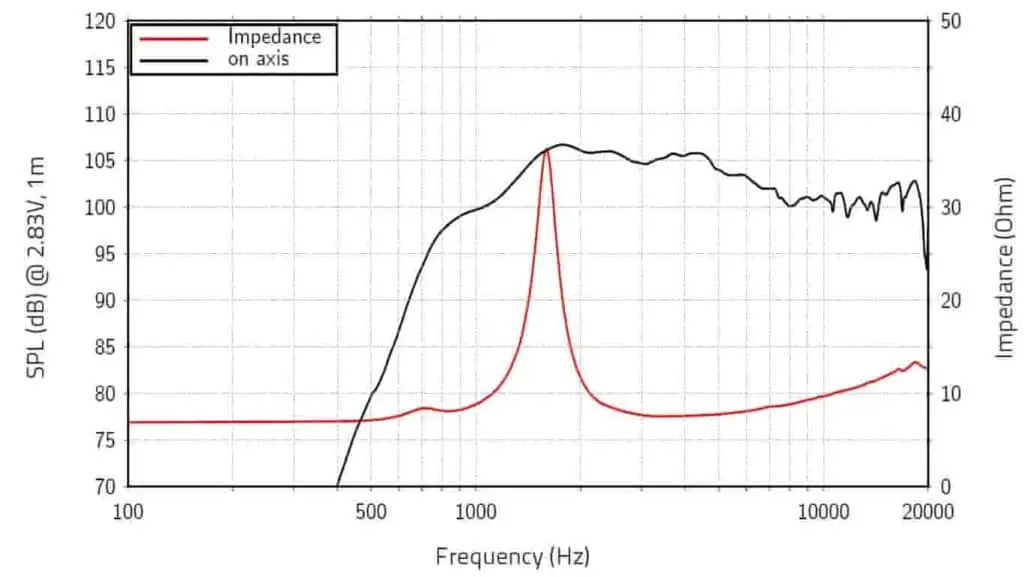
Here is an example of a speaker frequency response and impedance curve taken from a major loudspeaker manufacturer. This speaker is an HF compression driver. [source]
In the following curve, the top curve (black) is the frequency response and the bottom curve (red) is the impedance curve.
In order to really understand a speaker impedance curve, we need to look at some basic concepts, including graph layout.
It is very common for speaker designers to display speaker impedance alongside frequency response, as shown in the measured speaker curve as shown above. On a practical note, this makes life easier, as you can read as much data as possible from one curve.
However, it is just the red line in the above image, the impedance curve, that we are interested in for this example, and can ignore the black frequency response curve.
In any graph, there are two axes: the x-axis and the y-axis.
The x-axis is typically horizontal, and the y-axis is typically vertical.
In a speaker impedance curve, the x-axis represents frequency (measured in Hz), and the y-axis represents impedance (measured in ohms).
In Figure 1, the impedance (ohms) is read from the right-hand side axis.
In a nutshell, you can extract four key pieces of information from the impedance curve. I have labelled these as points A, B, C, and D in the following image.

1. A = DC resistance (Re)
The lowest value on the left side of the curve is the Re, DC resistance.
In the above curve, this is around 7.4 ohms.
2. B = Resonant Frequency
The position of this peak will tell us the resonant frequency of the speaker.
3. C = Total Q (Qts)
Qts or Total Q is a measure of the “sharpness” of the driver’s resonance peak. The higher the Qts, the more “peaked” or narrow the response at the resonant frequency. I have written more about what speaker Q is in this article, What is Speaker Q? (Qts, Qes, Qms Explained).
D = Impedance Increase
As frequency increases, so does the impedance. It is therefore normal to see a gradual curve increase of the impedance curve as you increase with frequency.
The impedance will rise as the voice coil induce increases.
How Is a Speaker Impedance Curve Measured?
In very simple terms, to produce a speaker impedance curve, you need to measure the voltage to and current through a speaker, and plot that for every frequency applied to the speaker.
In the professional audio industry, a speaker is placed in an anechoic chamber with a measurement microphone placed 1m away from the centre of the speaker.
A frequency sweep between 20Hz to 20kHz is played through the speaker.
Measurement hardware and software (for example, Klippel) will record and plot the impedance curve to the frequency sweep.
These will be the frequency SPL and impedance plots that you see on the websites of loudspeaker manufacturers.
Final Thoughts
In order to read a speaker impedance curve, it is important to understand the basics of graph layout and what information can be extracted from the curve.
The key information that can we can extract from a speaker impedance curve includes the speaker DC resistance (Re), the speaker resonant frequency, and the speaker Qts. By understanding these points, you can get a better idea of how a speaker will perform.
With a bit of practice, reading a speaker’s impedance curve becomes much easier. By understanding the fundamentals and what key points to look for, it is possible to gain insight into the performance characteristics of any given loudspeaker.
Happy listening!